Introduction
This project presents a Sales Analysis Dashboard built in Advanced Excel for FNP to track revenue, orders, delivery performance, and customer value. The dashboard enables quick filtering by occasion and date and highlights trends across categories, cities, months, and hourly order time.
Skills Showcased
- Advanced Excel (Pivot Tables, Pivot Charts, Slicers, Timelines)
- Dashboard Design & KPI Cards
- Data Cleaning & Data Modeling
- Trend Analysis (Monthly & Hourly)
- Top-N Analysis (Top Cities / Top Products)
Key KPIs
1000
Total Orders
₹ 35,20,984.00
Total Revenue
5.53
Order–Delivery Time
₹ 3,520.98
Avg. Customer’s Sales
Dashboard Preview
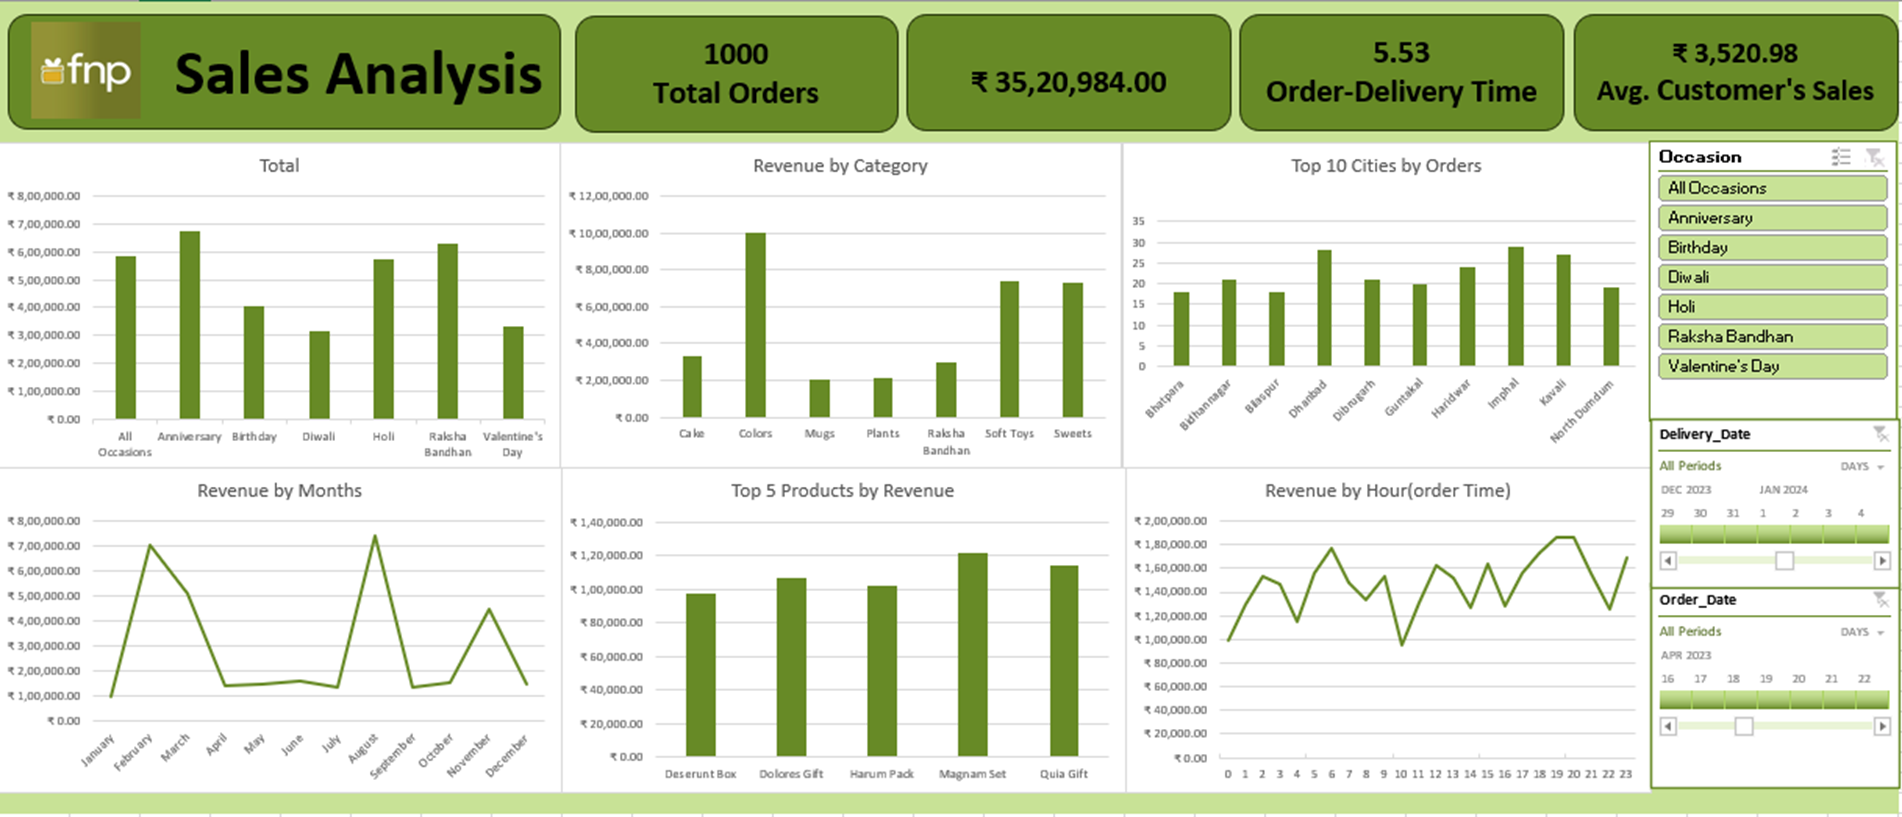
What the Dashboard Covers
- Revenue by Occasion (Anniversary, Birthday, Diwali, Holi, Raksha Bandhan, Valentine’s Day)
- Revenue by Category (Cakes, Colors, Mugs, Plants, Soft Toys, Sweets, etc.)
- Top Cities by Orders to identify high-demand markets
- Revenue by Month to track seasonality and peak periods
- Top Products by Revenue to identify best-selling items
- Revenue by Hour (Order Time) to understand customer purchase behavior
Interactivity
- Occasion Filter to instantly compare performance across events
- Date Timelines to analyze trends over selected periods
- Consistent layout with KPI cards for quick executive-level reporting
Conclusion
This Excel dashboard provides a clear, decision-ready view of sales performance for FNP by combining KPI tracking, trend analysis, and interactive filters. It supports faster business decisions for promotions, inventory planning, and operational improvements.